Research Interests
Combining experimental measurements with multi-level modeling techniques, such as finite element method, phase field, molecular dynamics simulation and first principle calculation, understand the nano and micro-mechanics of materials at the multi-level, and guide the design and fabrication of advanced materials.
Feature Research
Discovery of materials with extreme mechanical properties. (a) In the science fiction novel “The Three-Body Problem”, “Flying Blade” nanofilaments possess remarkable strength and stiffness, enabling them to effortlessly slice through a target ship; (b-c) Materials with the highest known specific Young’s modulus, specific tensile strength, and specific strain energy density. (Advanced Science, 2204884, 2023; Matter, 5, 1192-1203, 2022)
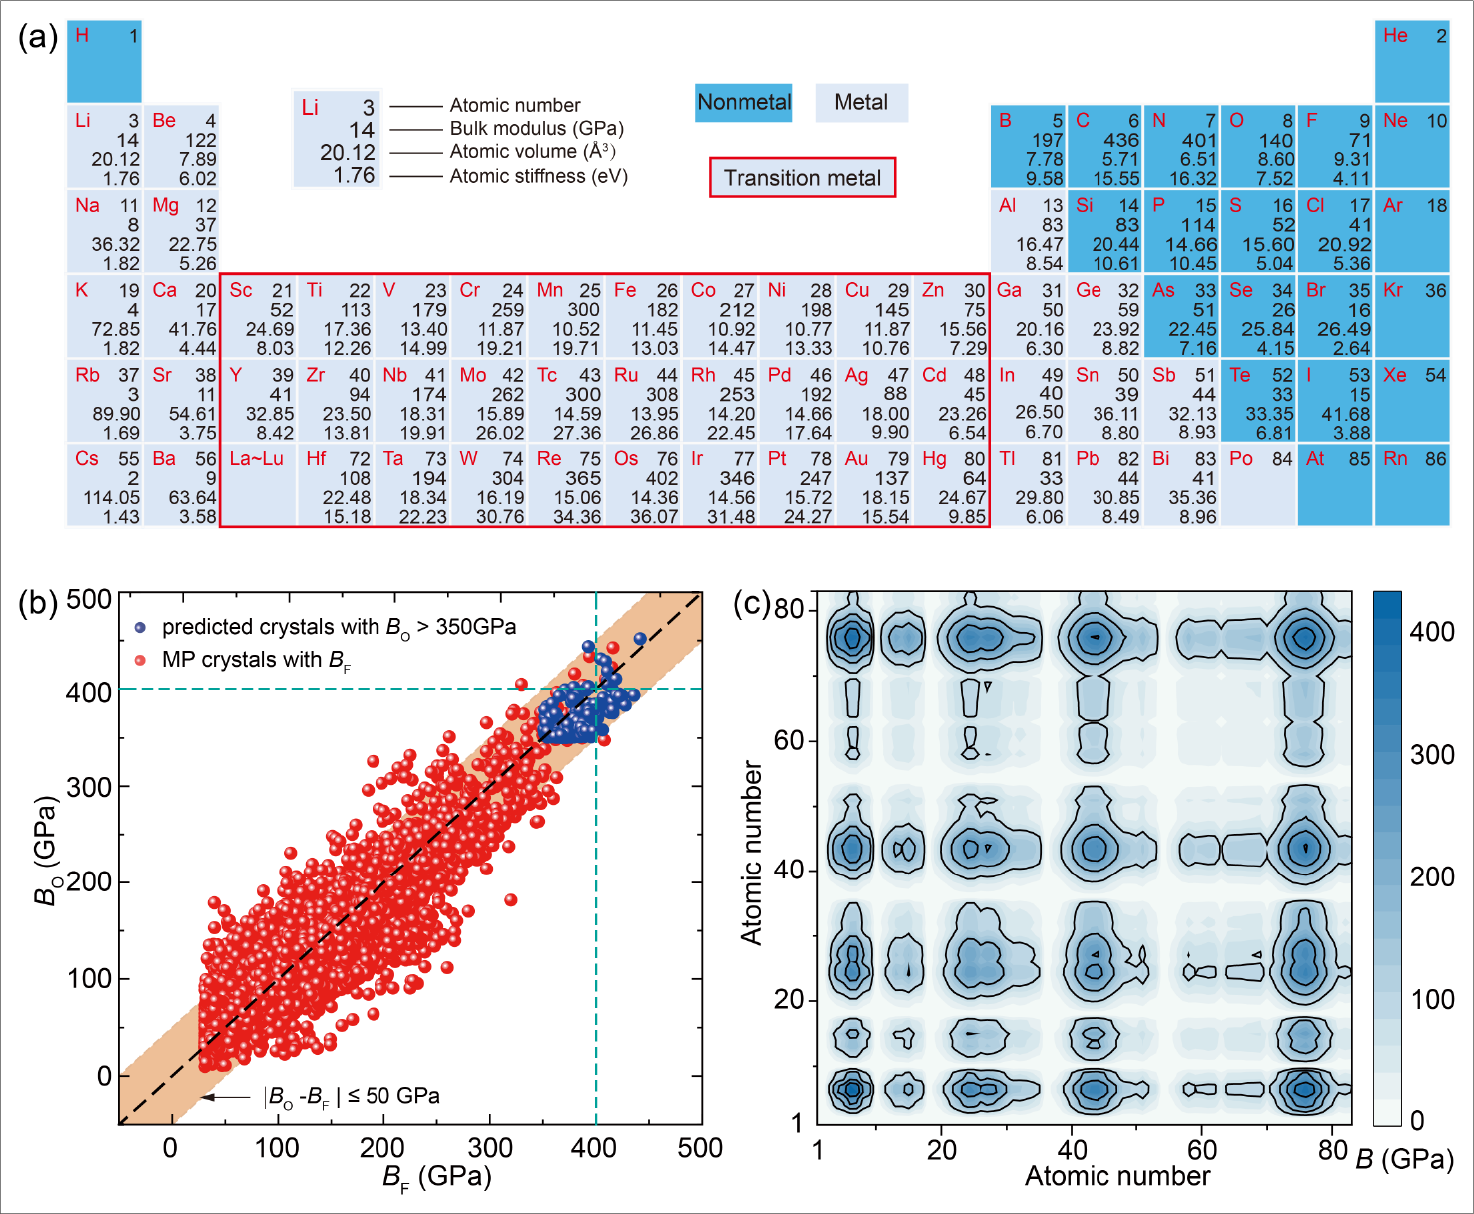
Research on the limits of bulk modulus. (a) Bulk moduli, atomic volumes, and atomic stiffnesses for elements within the periodic table; (b) Comparison between predicted bulk modulus of thousands of crystals in the database and first-principles calculations; (c) Treasure map of ultraincompressible materials. (Nature, Communications, 14, 4258, 2023)
Research on the limits of Young’s modulus. (a) Development of microscopic models for extreme Young’s modulus, determination of theoretical bounds on the Young’s modulus, and data-driven validation on the bounds; (Physical Review Applied, 18, 014044, 2022) (b-c) Design of materials with mechanical properties approaching the theoretical bounds. (Advanced Science, 2204884, 2023)
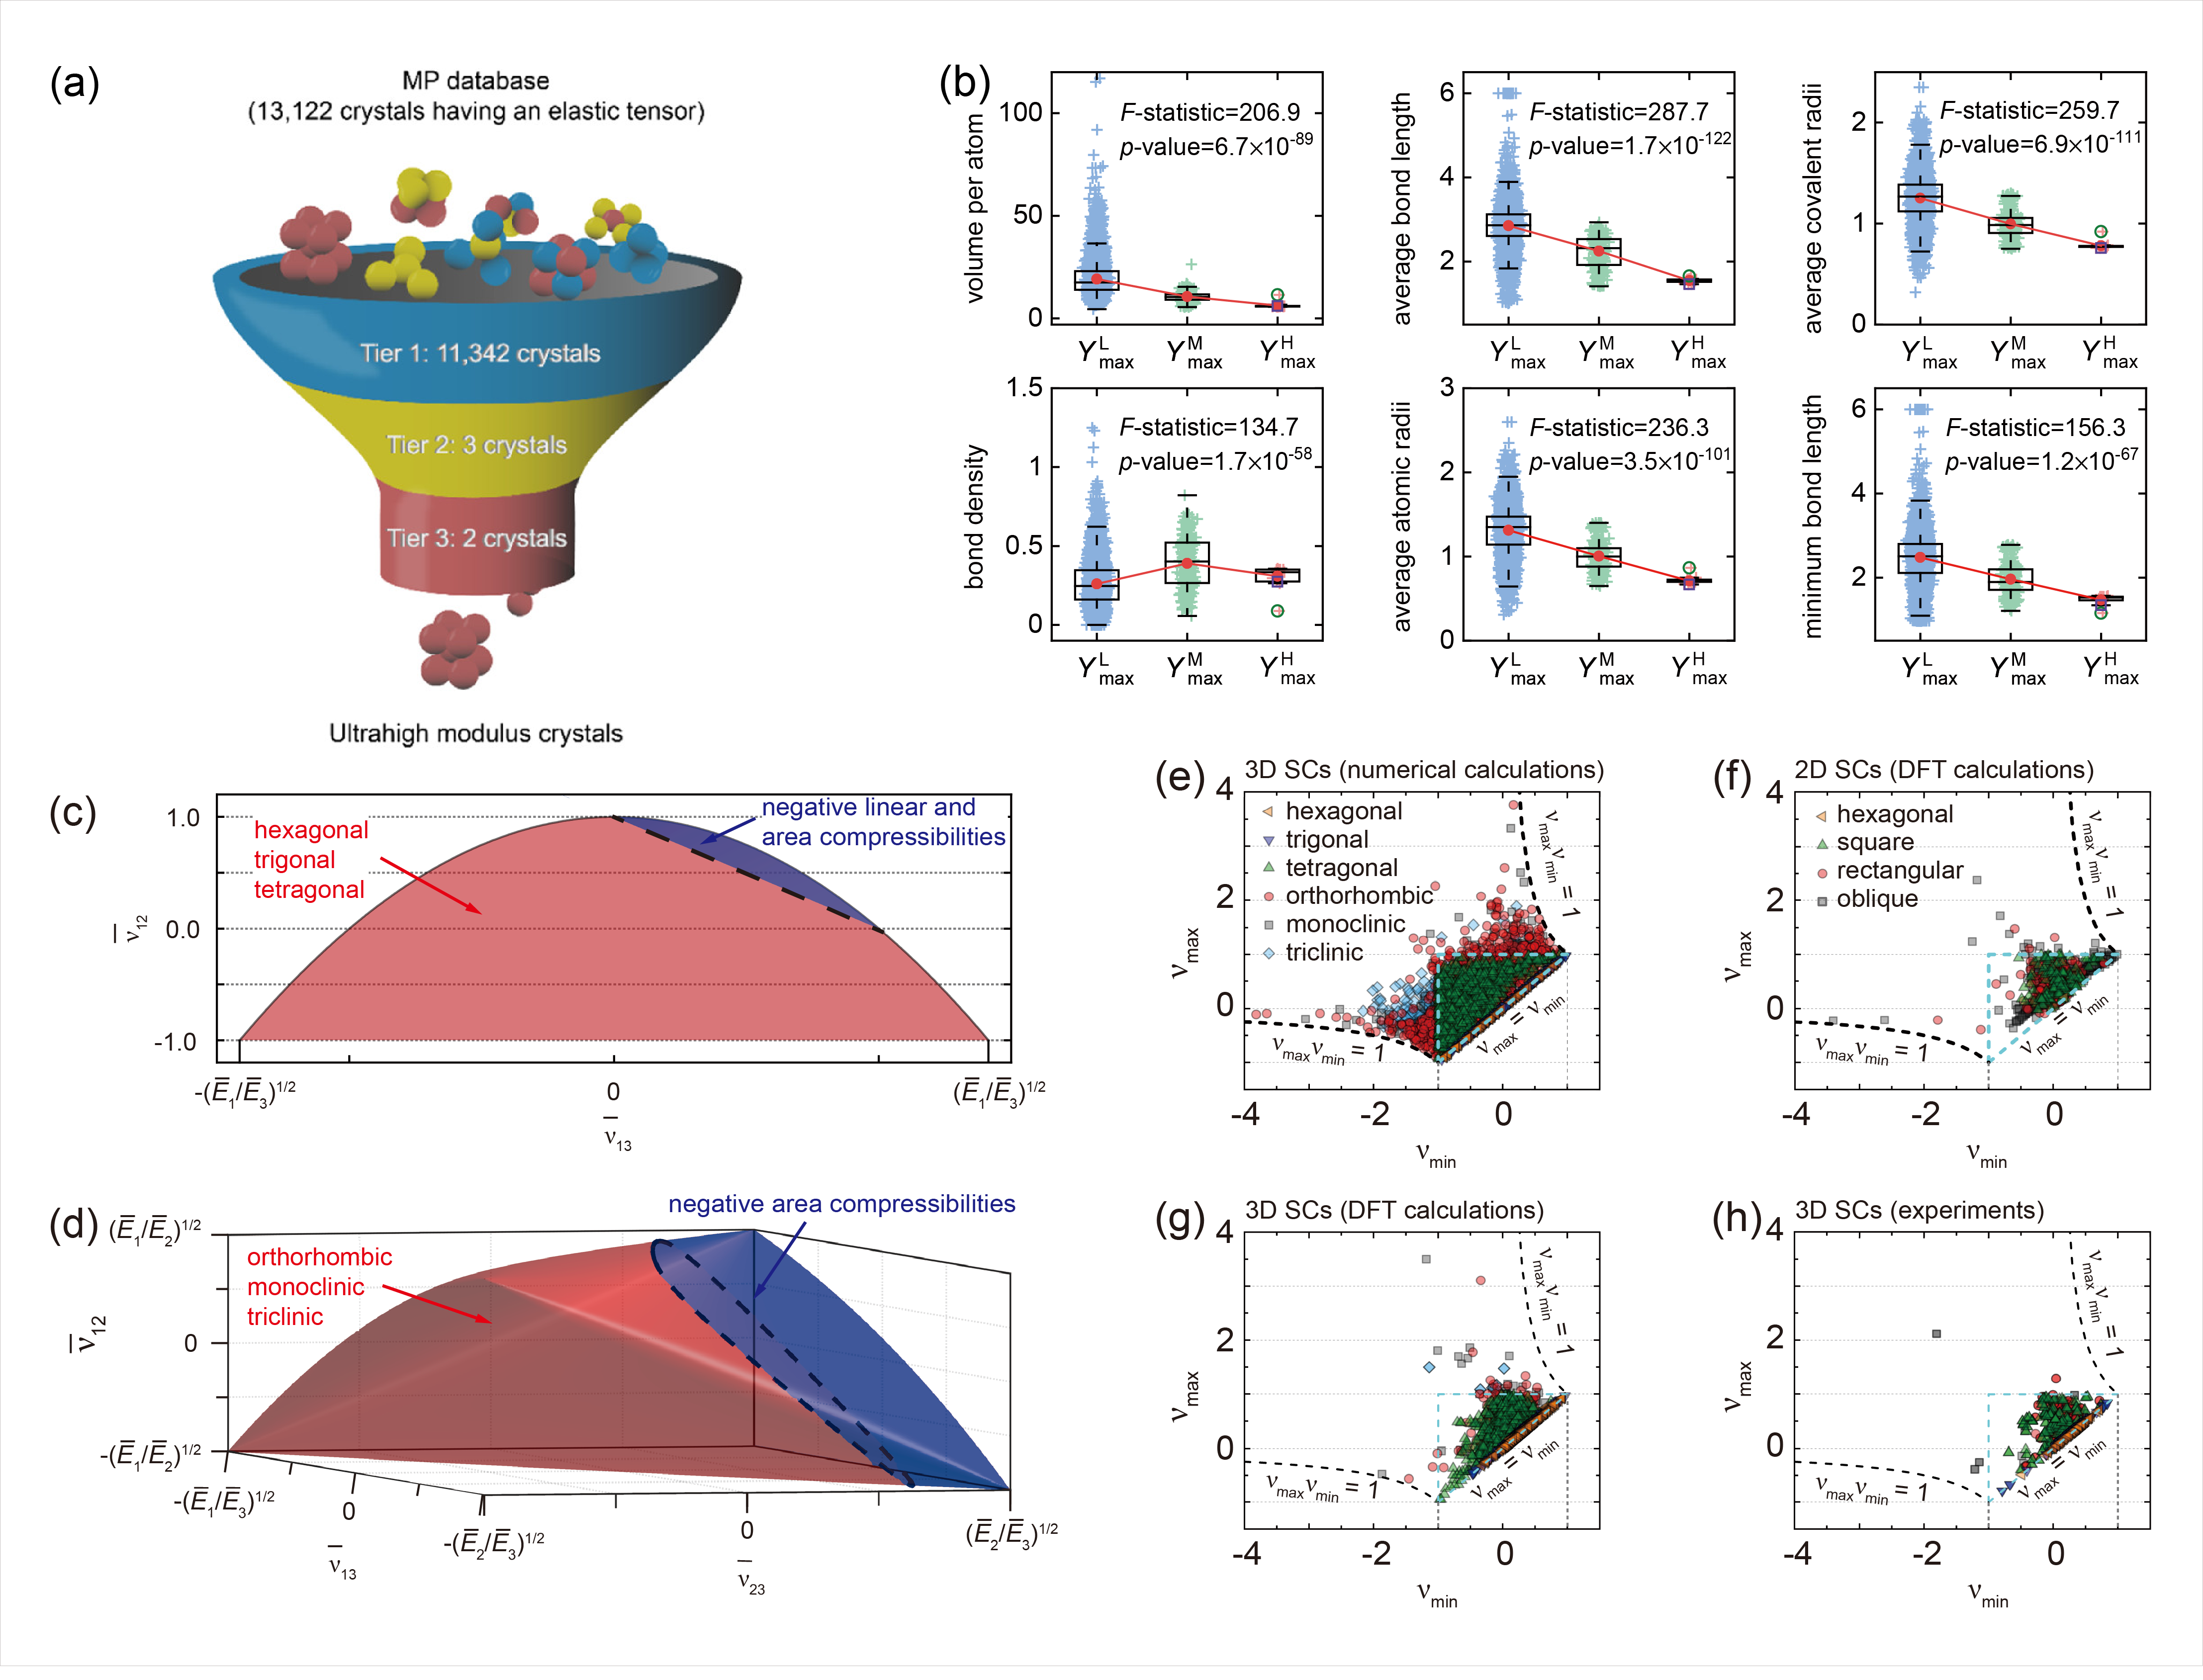
(a) Illustration of screening processes. Tier 1: Crystals with a nonpositive definite stiffness matrix were filtered out. Tier 2: Crystals containing radioactive elements or possessing a maximum Young’s modulus less than 1300 GPa were filtered out. Tier 3: The Young’s moduli of ultrahigh modulus crystals were validated by reperforming first-principles calculations. (b) Boxplots of six identified features from 10 903 crystals that were divided into three groups including YmaxL (Ymax < 500 GPa), YmaxM (500 GPa ≤ Ymax ≤ 1000 GPa), YmaxH (Ymax > 1000 GPa). On each black box, the central mark indicates the median, and the bottom and top edges indicate the 25th and 75th percentiles of features, respectively. The “+” symbols represent the data points, where the outliers are determined by a whisker length of 1.5. The mean values of different groups are marked by red dots. The features of CN2 and OsN2 are marked in purple squares and green circles, respectively. The F-statistic and p-value are the results of analysis of variance tests. (Chemistry of Materials, 33, 1276–1284, 2021) Theoretical bounds on the Poisson's ratios for (c) hexagonal, trigonal, and tetragonal crystals and (d) monoclinic, orthorhombic, and triclinic sheet crystals (SCs). Bounds on the maximum and minimum in-plane Poisson’s ratios calculated from (e) numerically generated elastic tensors for 3D SCs, (f) elastic tensors from first principles calculations for 2D SCs, (g) elastic tensors from first principles calculations for 3D SCs, and (h) experimentally measured elastic tensors for 3D SCs. The dashed lines represent the theoretical bounds on the in-plane Poisson’s ratios. (Journal of the Mechanics and Physics of Solids, 152, 104409, 2021)
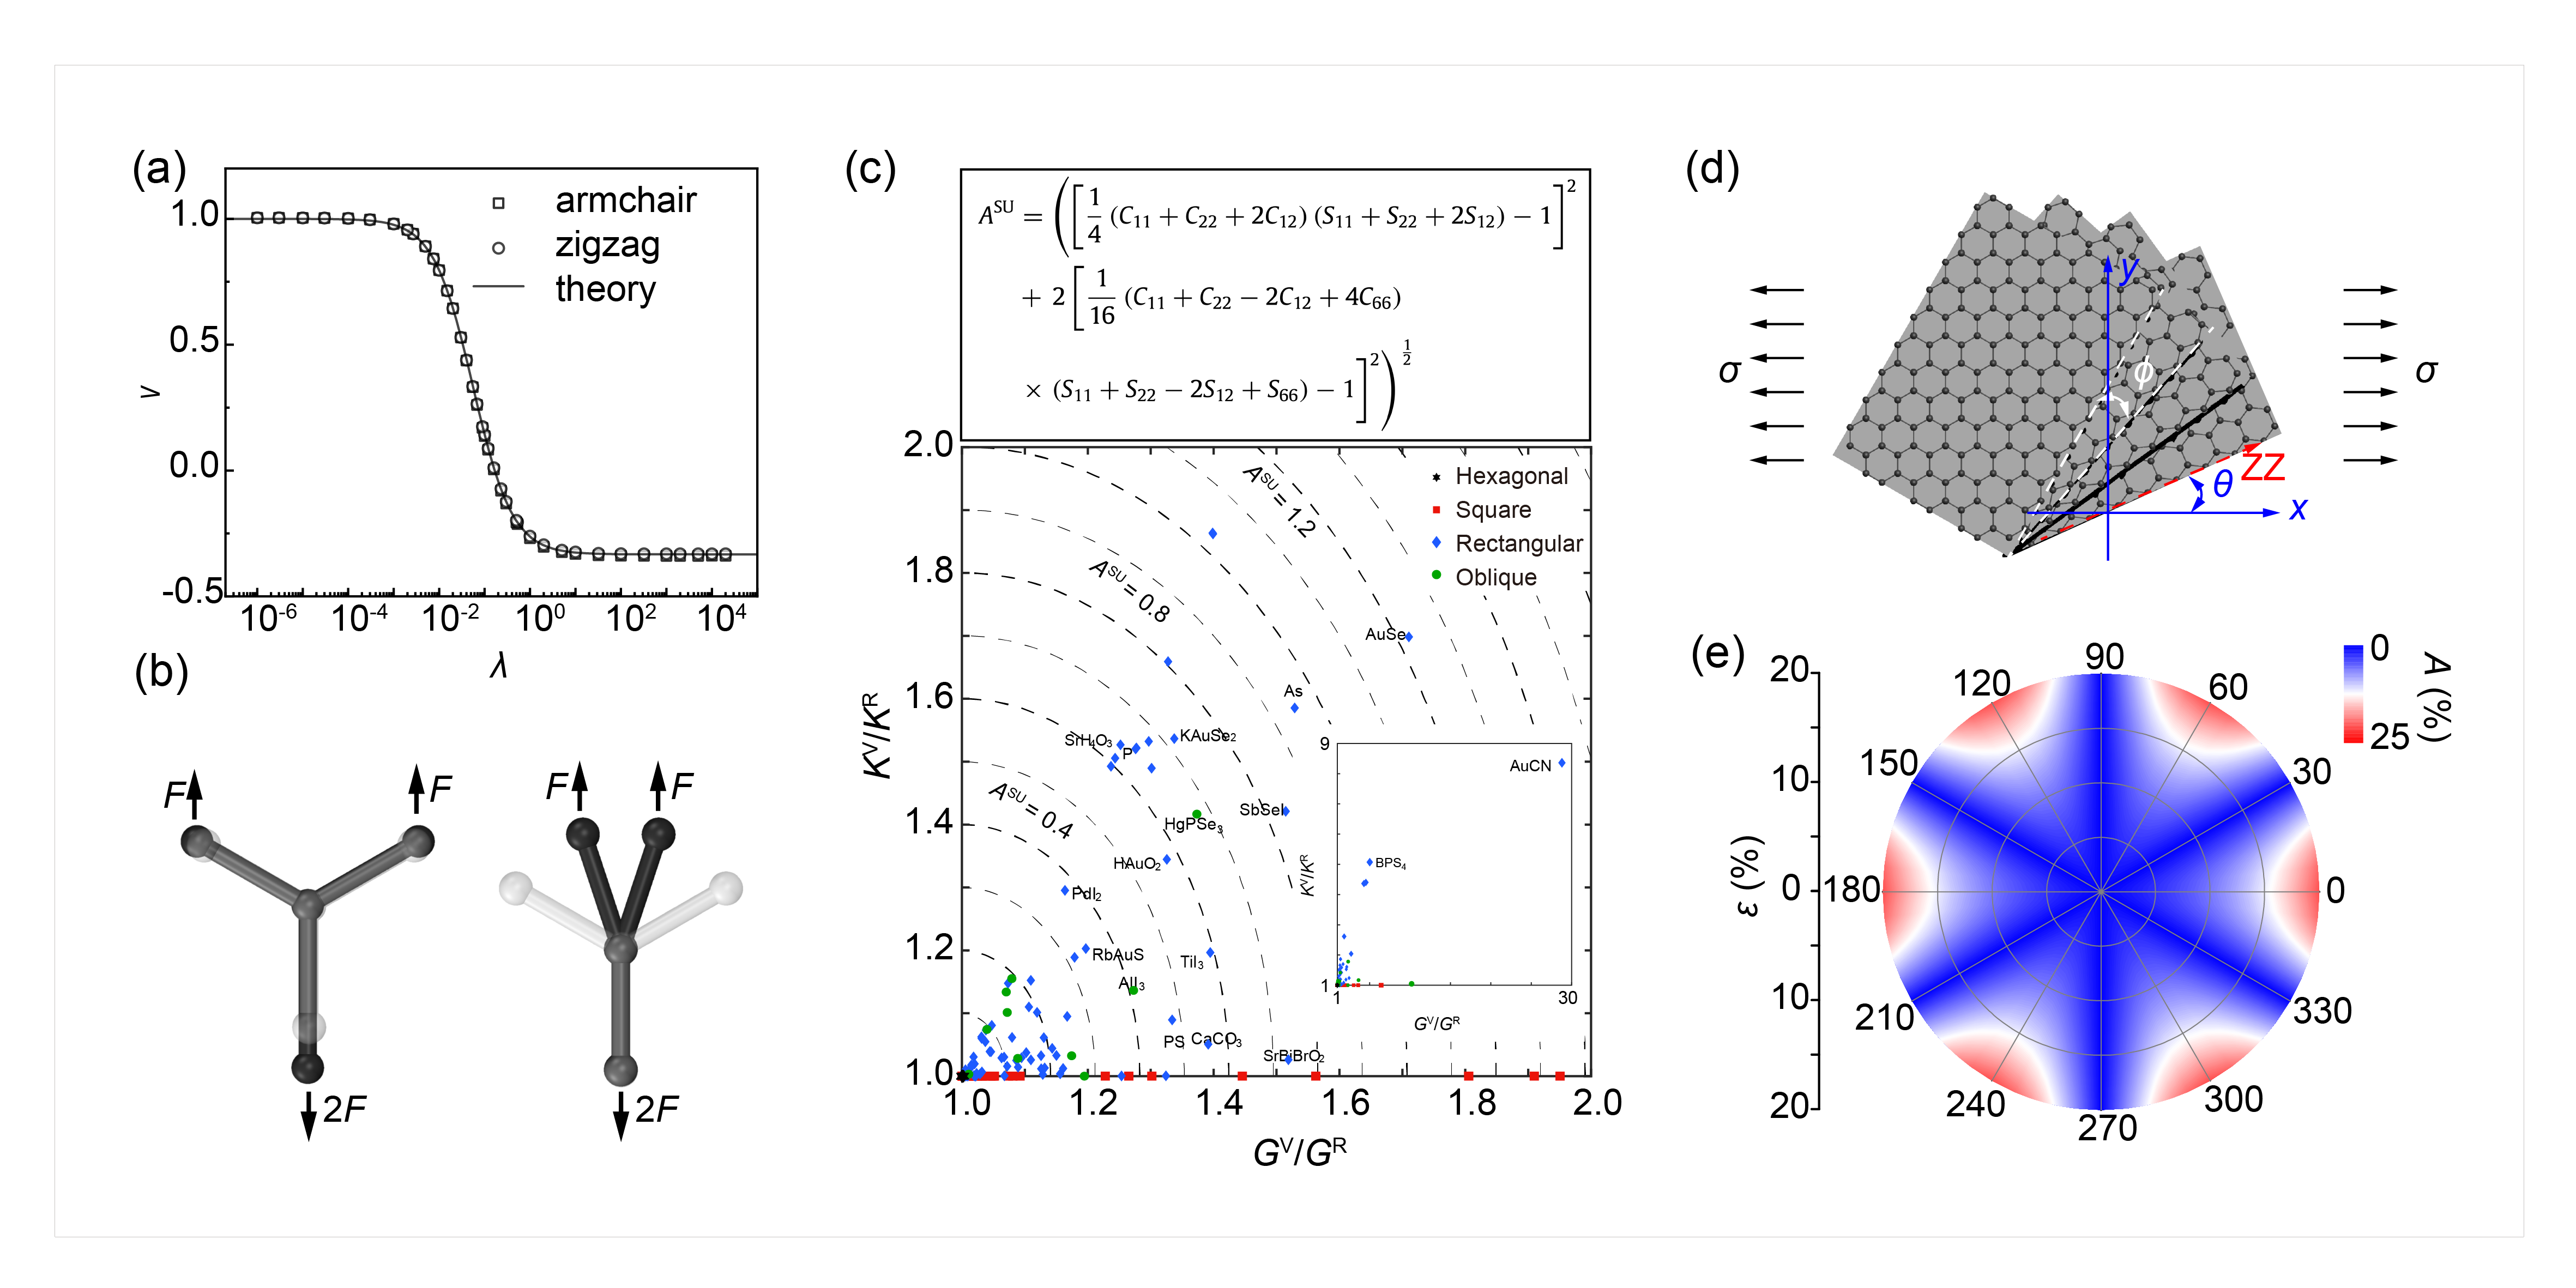
(a) Relationship between the Poisson’s ratio (ν) and the dimensionless factor (λ), in which λ is related to bond stiffness, angular stiffness and equilibrium bond length. The numerical simulation results are in good agreement with the theoretical prediction results. (b) Two extreme deformation modes of two-dimensional hexagonal crystals: Bond-stretching-dominated mode, where angles almost remain constant so the bond stretching dominates the deformation, signifying lower bound of Poisson’s ratio (−1/3); Angle-changing-dominated mode, where bond lengths almost keep unchanged so angle changing dominates the deformation, signifying upper bound of Poisson’s ratio (+1). (Extreme Mechanics Letters, 38, 100748, 2020) (c) Expression of elastic anisotropy index ASU and elastic anisotropy diagram for 2D crystals. (Extreme Mechanics Letters, 34, 100615, 2020) (d) Illustration of multilayer graphene oriented in a way that the angle between the zigzag direction of bottom graphene layer and the x-axis is θ, and the interlayer is twisted by an angle ϕ. The load is applied along x-axis. (e) The mechanical anisotropy degree of bilayer graphene as a function of ɛ and ϕ. (Journal of Applied Mechanics, 88, 011007, 2020)
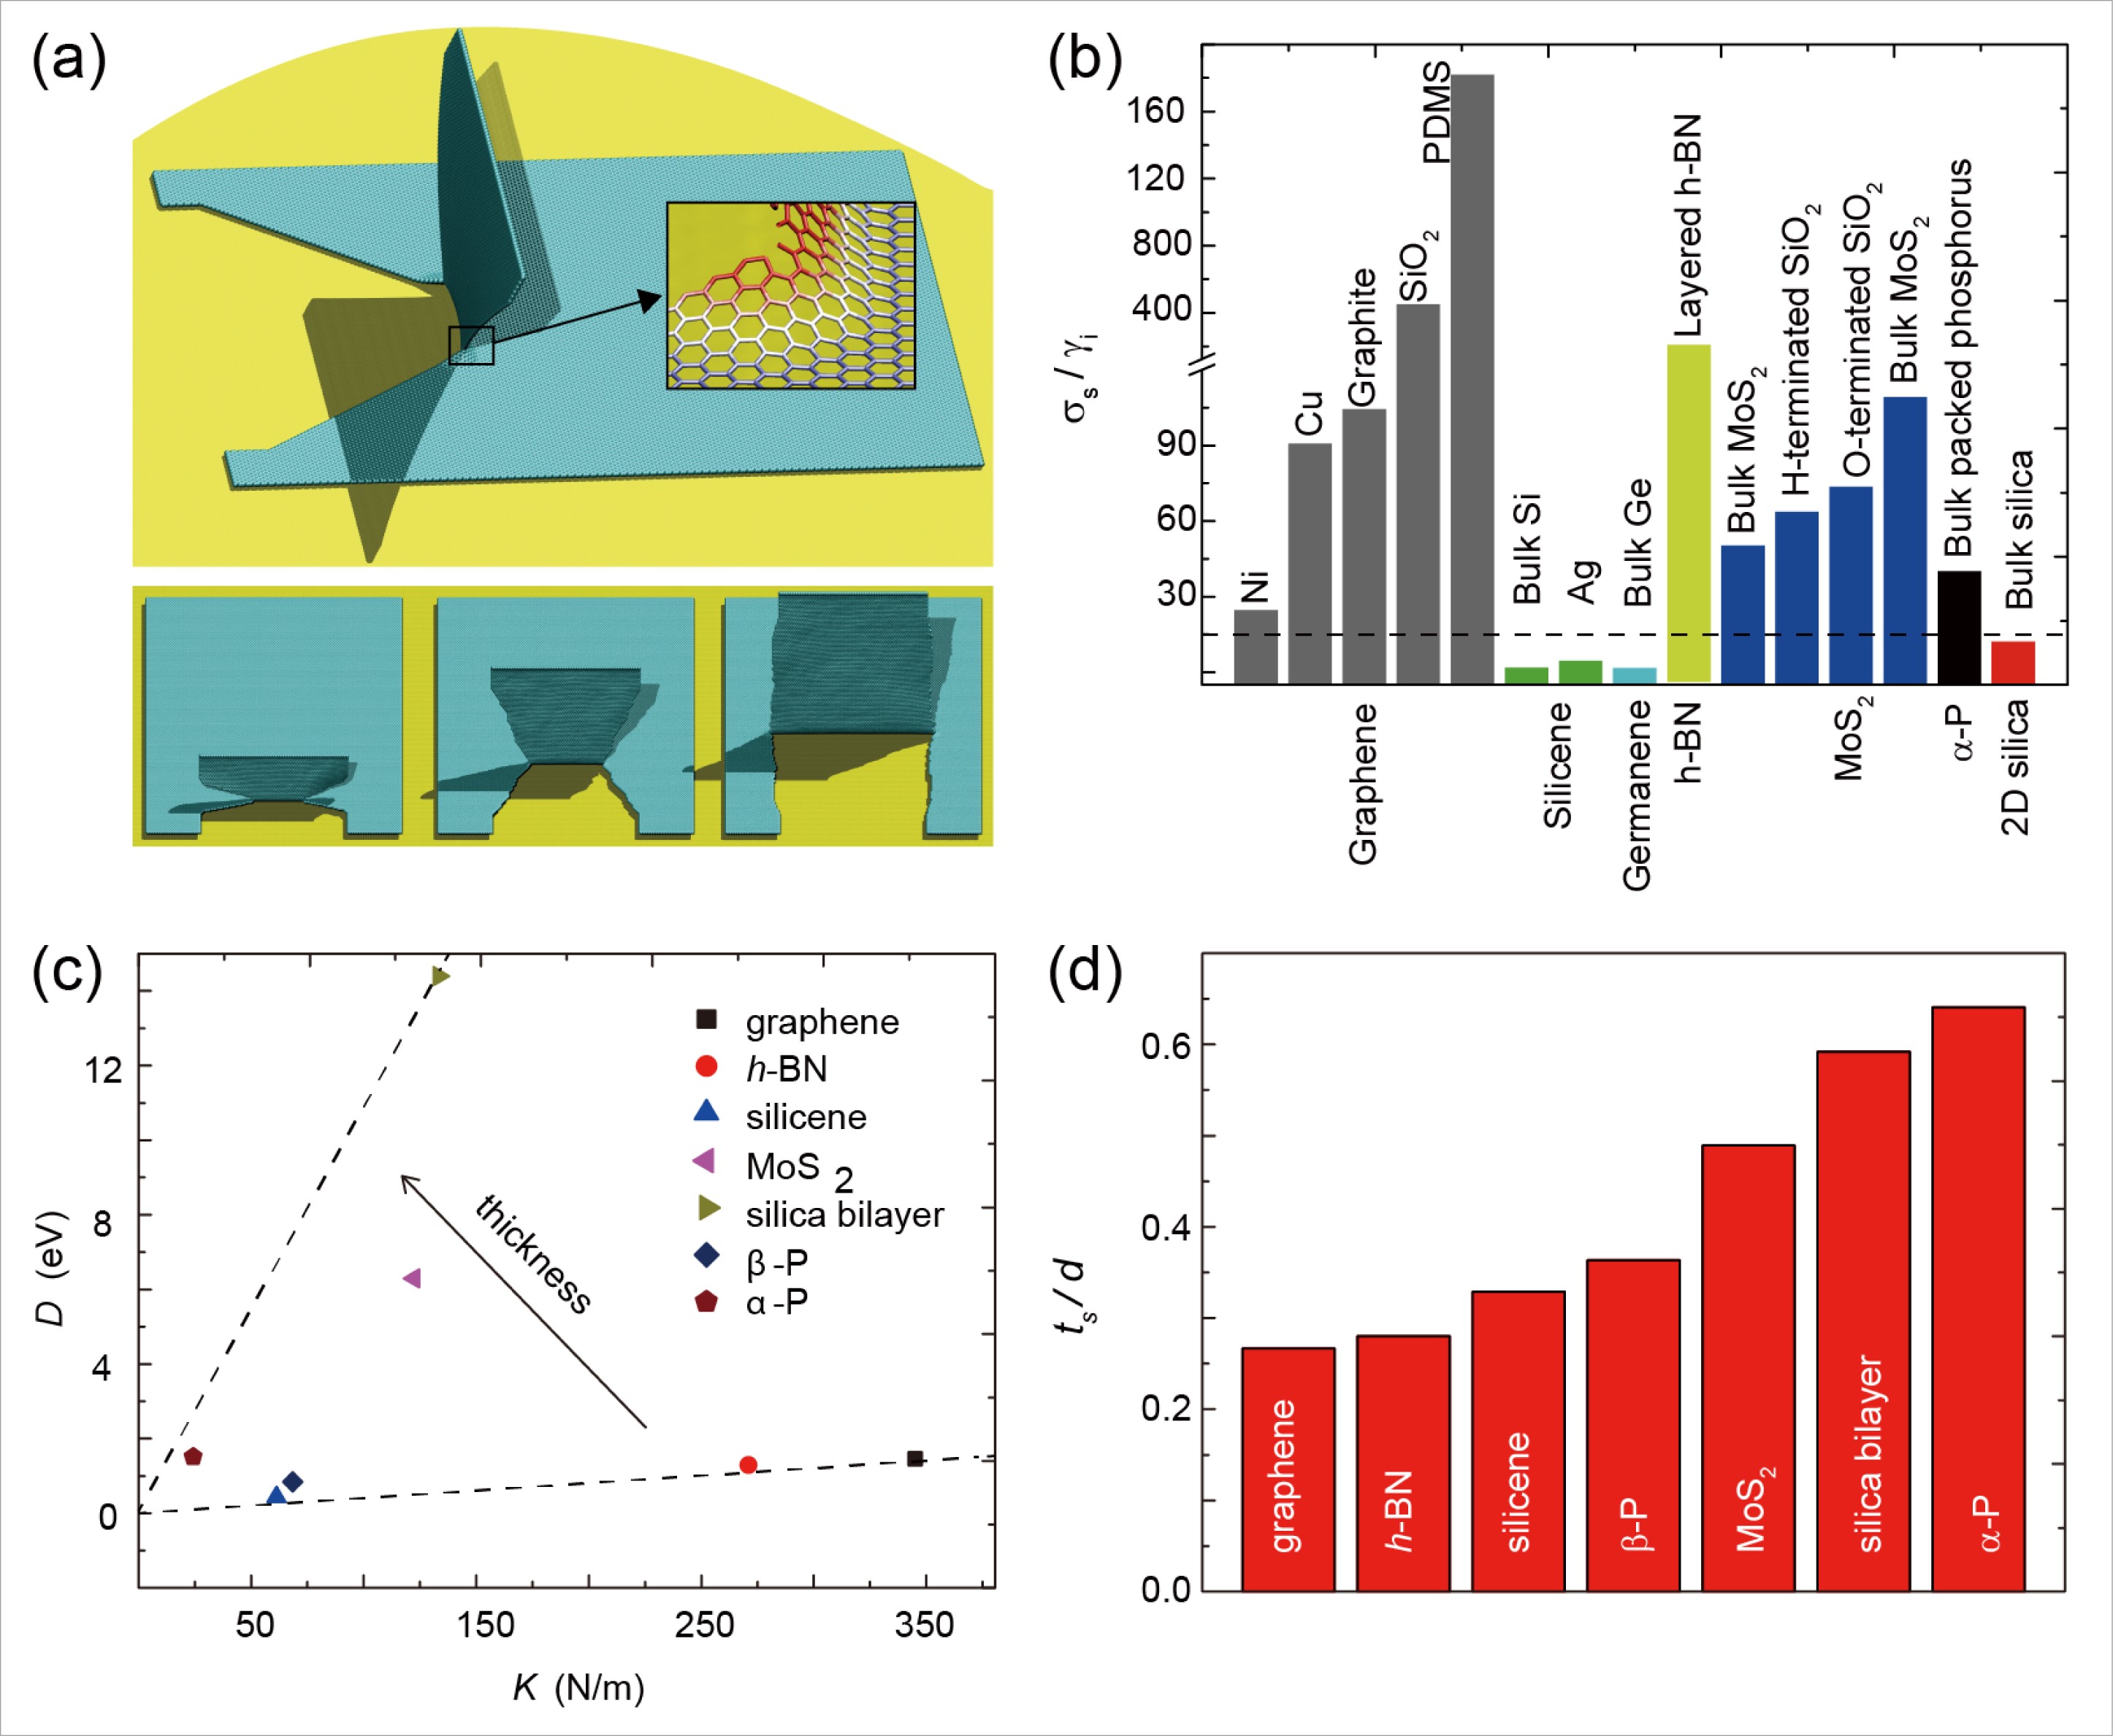
(a) Detailed views of the peeling front and edges, where the width w changes with peeling. The results are obtained from our coarse-grained molecular dynamics simulations. (b) The feasibility factor σs/γi calculated for two-dimensional sheets on the substrate. (Journal of the Mechanics and Physics of Solids, 115, 248-262, 2018) (c) Tensile stiffness K, bending stiffness D. (d) The factor of consistency, c, calculated for two-dimensional materials, showing the difference in the definitions of thickness of two-dimensional materials—the thin-shell thickness or interlayer distance in their layer-by-layer assemblies. (Journal of Applied Mechanics. 82, 121012, 2015)
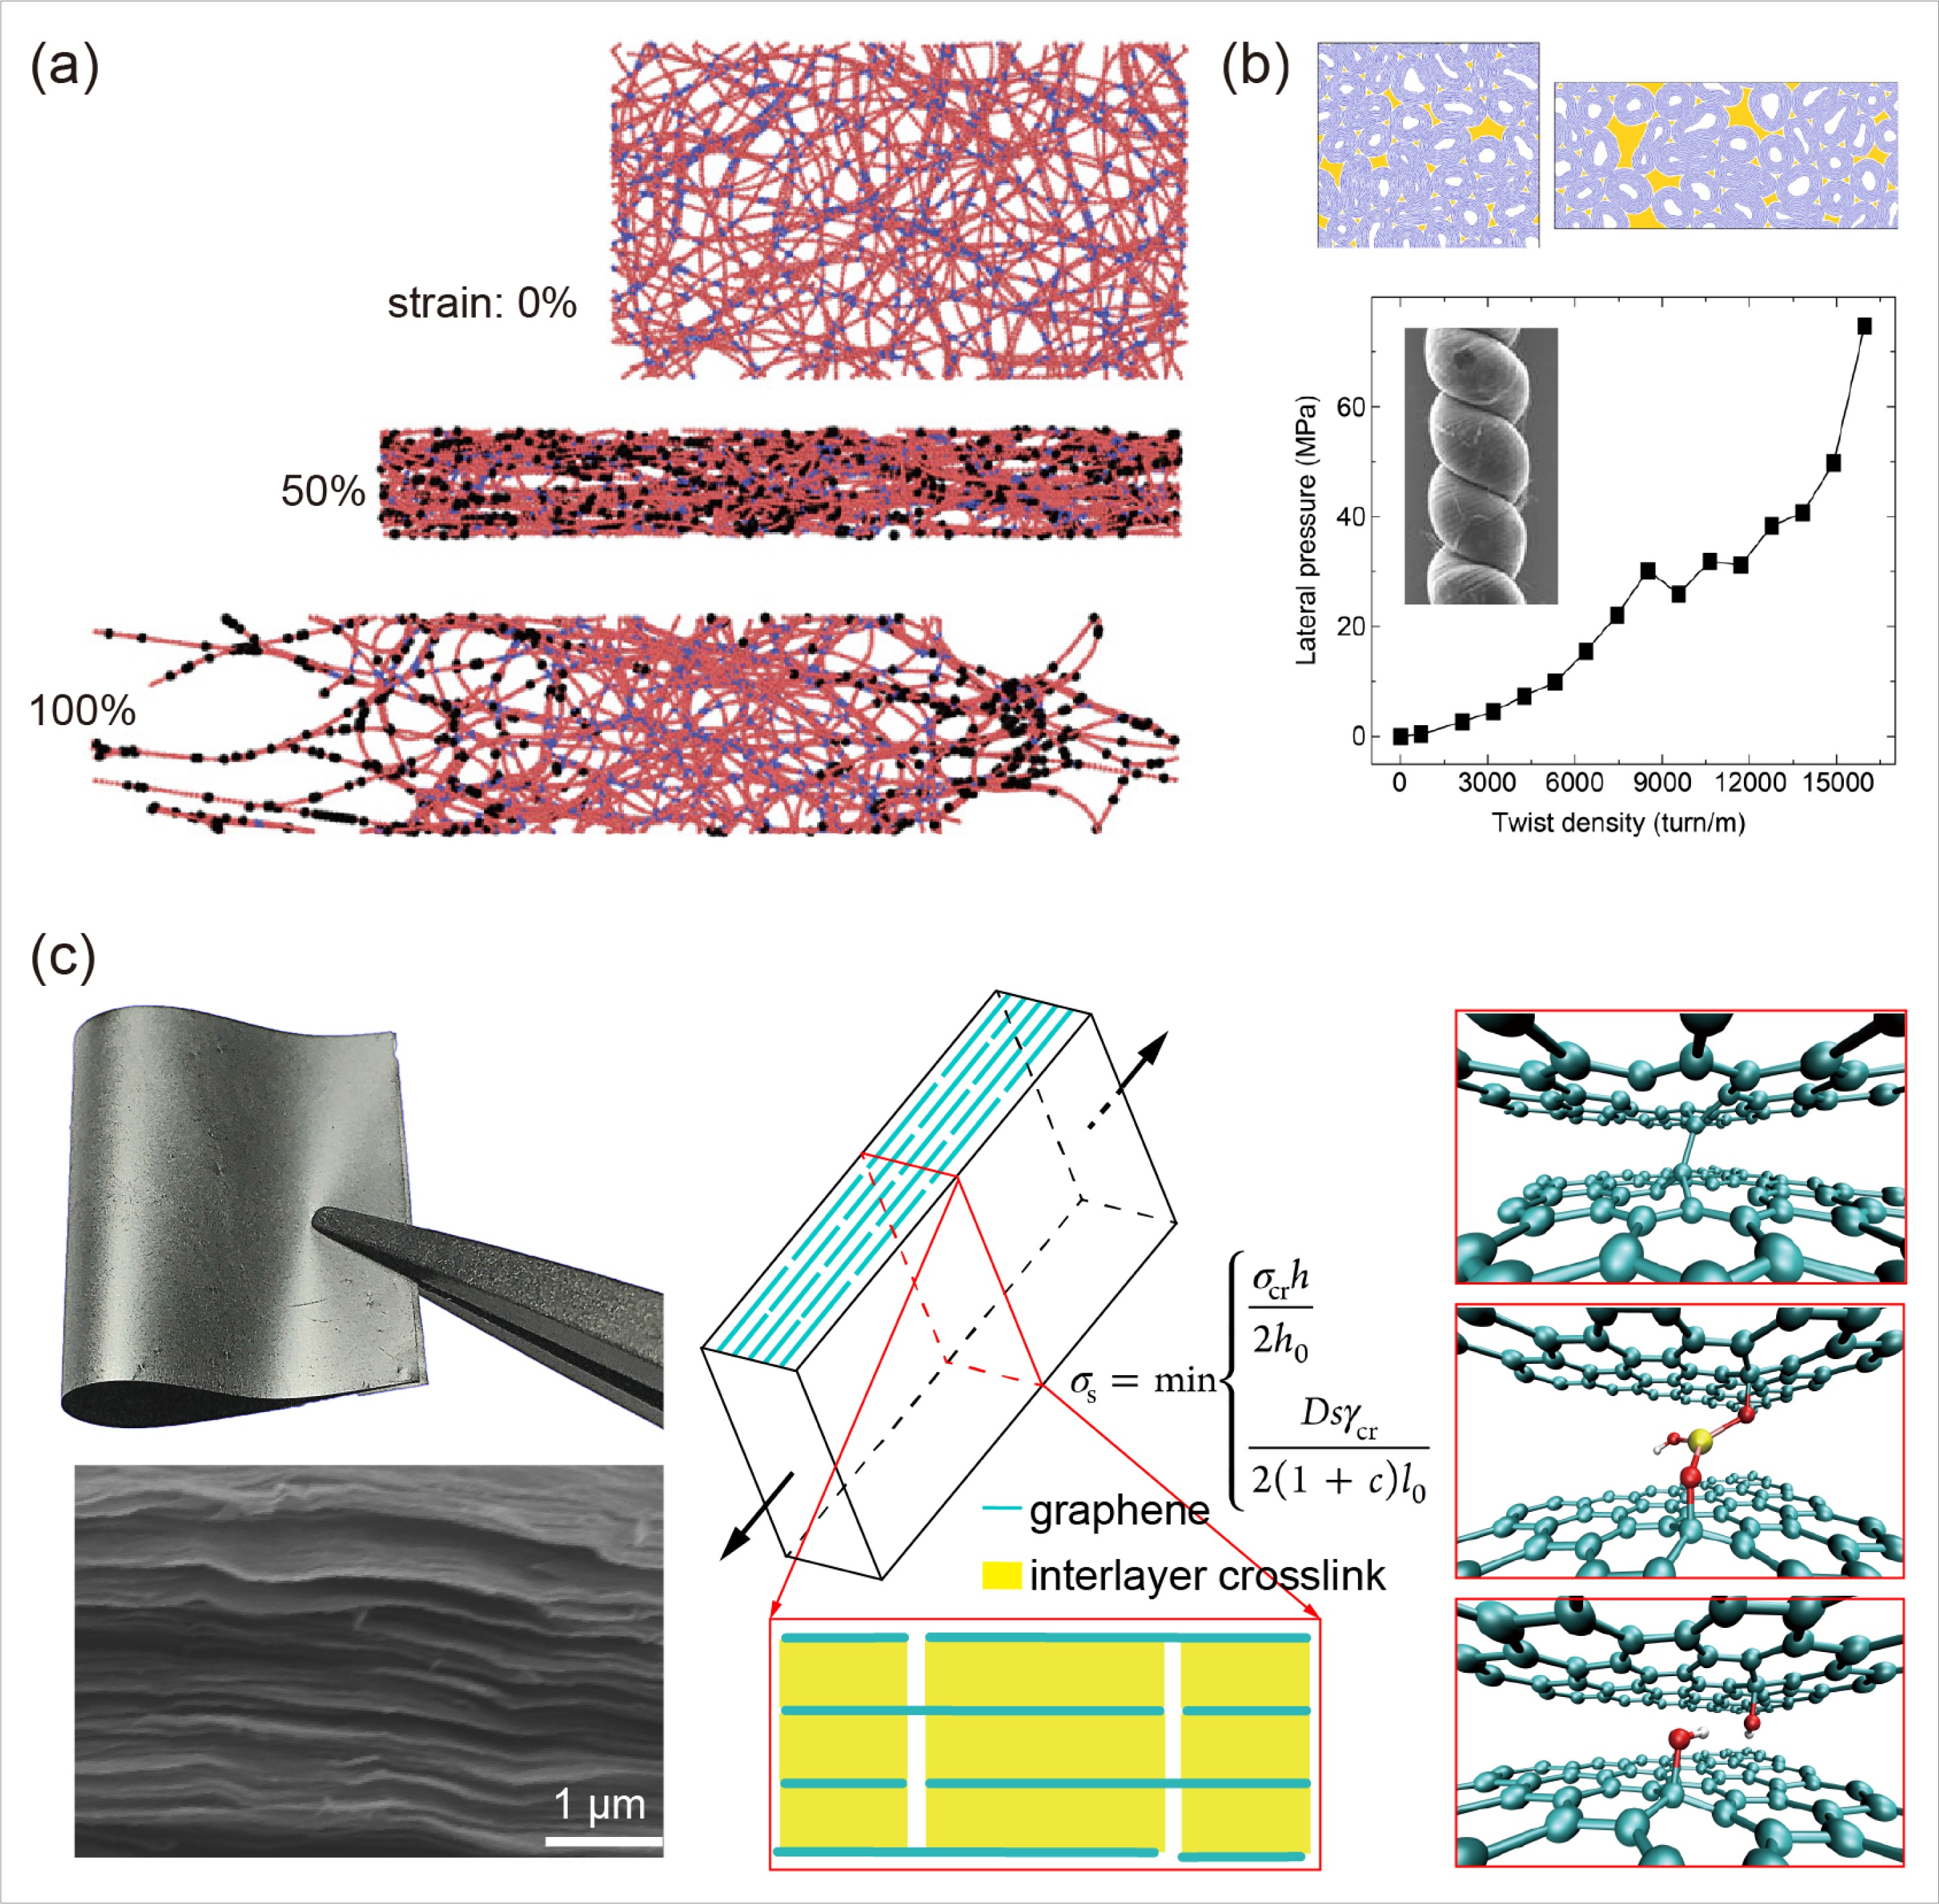
(a) Simulation snapshots showing the material fracture processes at different strain levels, as defined by the breakage of crosslinks. (Comptes Rendus Mecanique, 342, 264-272, 2014) (b) Molecular dynamics simulations to model the effect of twist-induced pressure on the electrochemically accessible void space within multiwalled nanotube bundles. The calculated volume-averaged lateral pressure on multiwalled nanotubes in a twistron yarn as a function of the twist density. (Science 357, 773-778, 2017) (c) Experimental characterization and mechanical modelling of graphene membranes. Deformable tensile-shear model. Detailed atomic structures of the cross-links considered in this work, which include the vacancy-induced covalent bond, the divalent atom (magnesium)-assisted coordinative bonds, and the hydrogen bond formed between two hydroxyl groups. (ACS Applied Materials and Interfaces 9, 24830–24839, 2017)

